Have a look at the Figure legends and the Methods section of the
corresponding paper. The autors classified promoters based on their
initiation pattern into two classes: broad and peak. They then studied
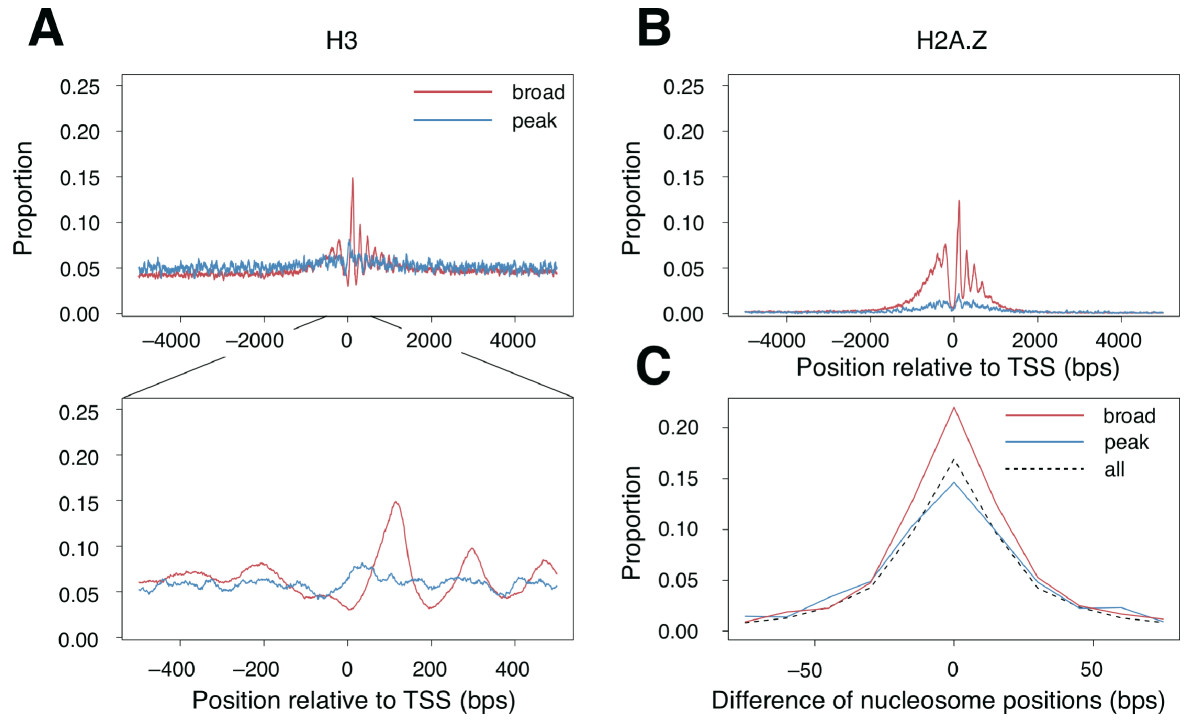
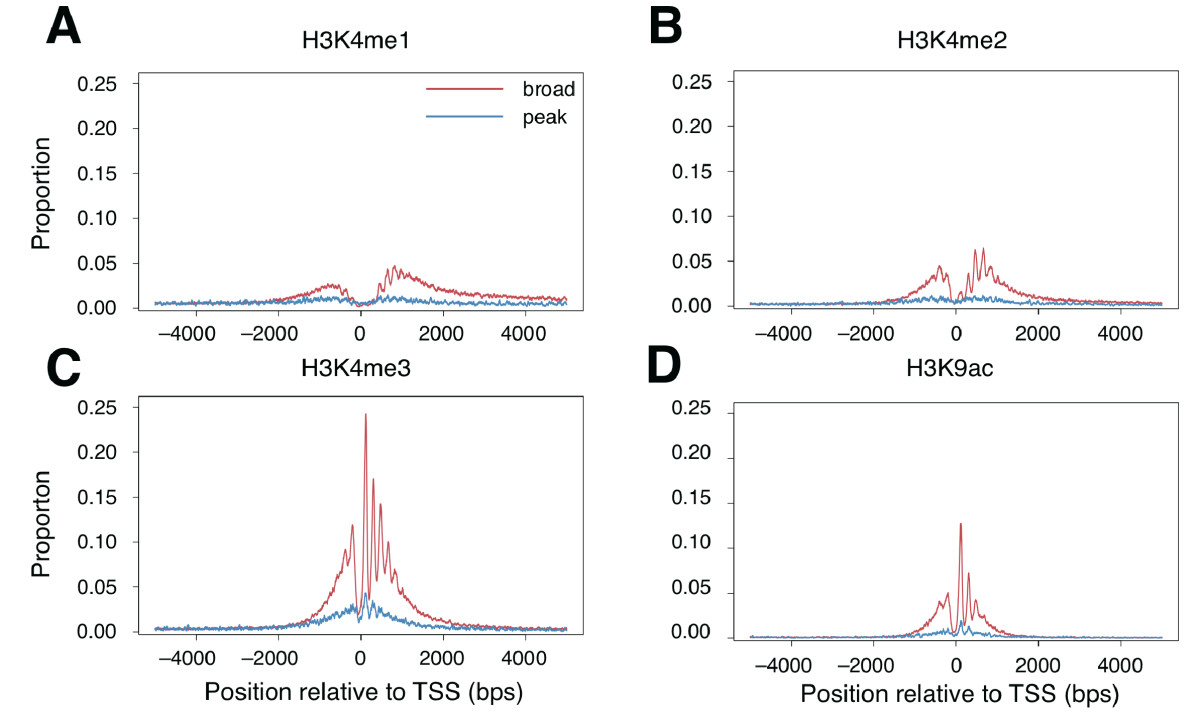
the chromatin organisation around the two promoter classes. Figure
1A,B and Figure 2 show similar things: the distribution around the two
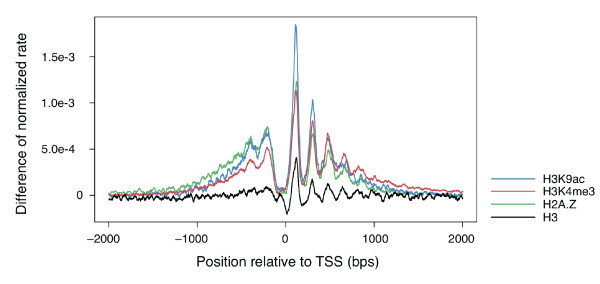
promoter classes of several histone marks. Figure 3 instead shows the
ratio (look in the paper for the exact definition) of the distribution
of the two classes for each histone mark.
Once you have found the
results you can check if the conclusion reported in the paper holds:
"around broad promoters histones were highly distributed and
aligned in a orerly fashon"
Hints and recipes
Note that the data used in this paper is present on the ChIP-Seq
server, aligned on hg18 genome assembly.
To reproduce the figures you should:
-
Instead of classify promoters based on their initiation pattern,
classify them based on the presence absence of the TATA-box in the
expected location. It has been reported before that TATA-box
promoters have a peak initiation pattern whereas non-TATA-box
promoters have a broad initiation pattern. To do so you have to
use FindM
-
Extract TATA-box promoters from EPDnew databse 003 for
genome assembly hg18.
-
Select a Sequence Range from -33 to -15
-
Select "Search mode" as forward and "Sequence Selection mode"
as "sequence with motifs".
-
Select the TATA-box matrix from "Promoter Motifs"
-
Run the job and save the SGA file as "peakPromoters.sga". You
shoul get 1922 promoters
-
Run again the analysis with the same parameters except
"Sequence Selection mode" selectin this time "sequence lacking
motif". Run the job, save the SGA file as
"broadPromoters.sga". You shoul have 21425 promoters
-
Now optimise ChIP-seq parameters for each sample you want to
correlate to the promoters. You can find these samples in the
ChIP-seq server under hg18 genome assembly, ChIP-seq data type and
Barski, Schones and Wang series.
-
Find centering parameter for each nucleosome sample. Use
ChIP-Cor for this task. It can be found looking at the correlation
plot between plus and minus strand tags.
-
You ca check if TATA-box promoters have a peak initiation pattern
looking at the CAGE distribution (you can use the DBTSS7 dataset
present for hg18 assembly) around them and compare to the
non-TATA-box promoters.
-
Find the histone distribution around promoters. Use ChIP-Cor for
this task. Note that promoters are oriented features. Use the
centering parameter found in the previous step for centering
target feature.
-
Save the TEXT file with numerical values of the distribution of
the histone marks / variants around promoters and, using R,
combine them in plots similar to the published figures.


