Lausanne, 27 April - 1 May 2015
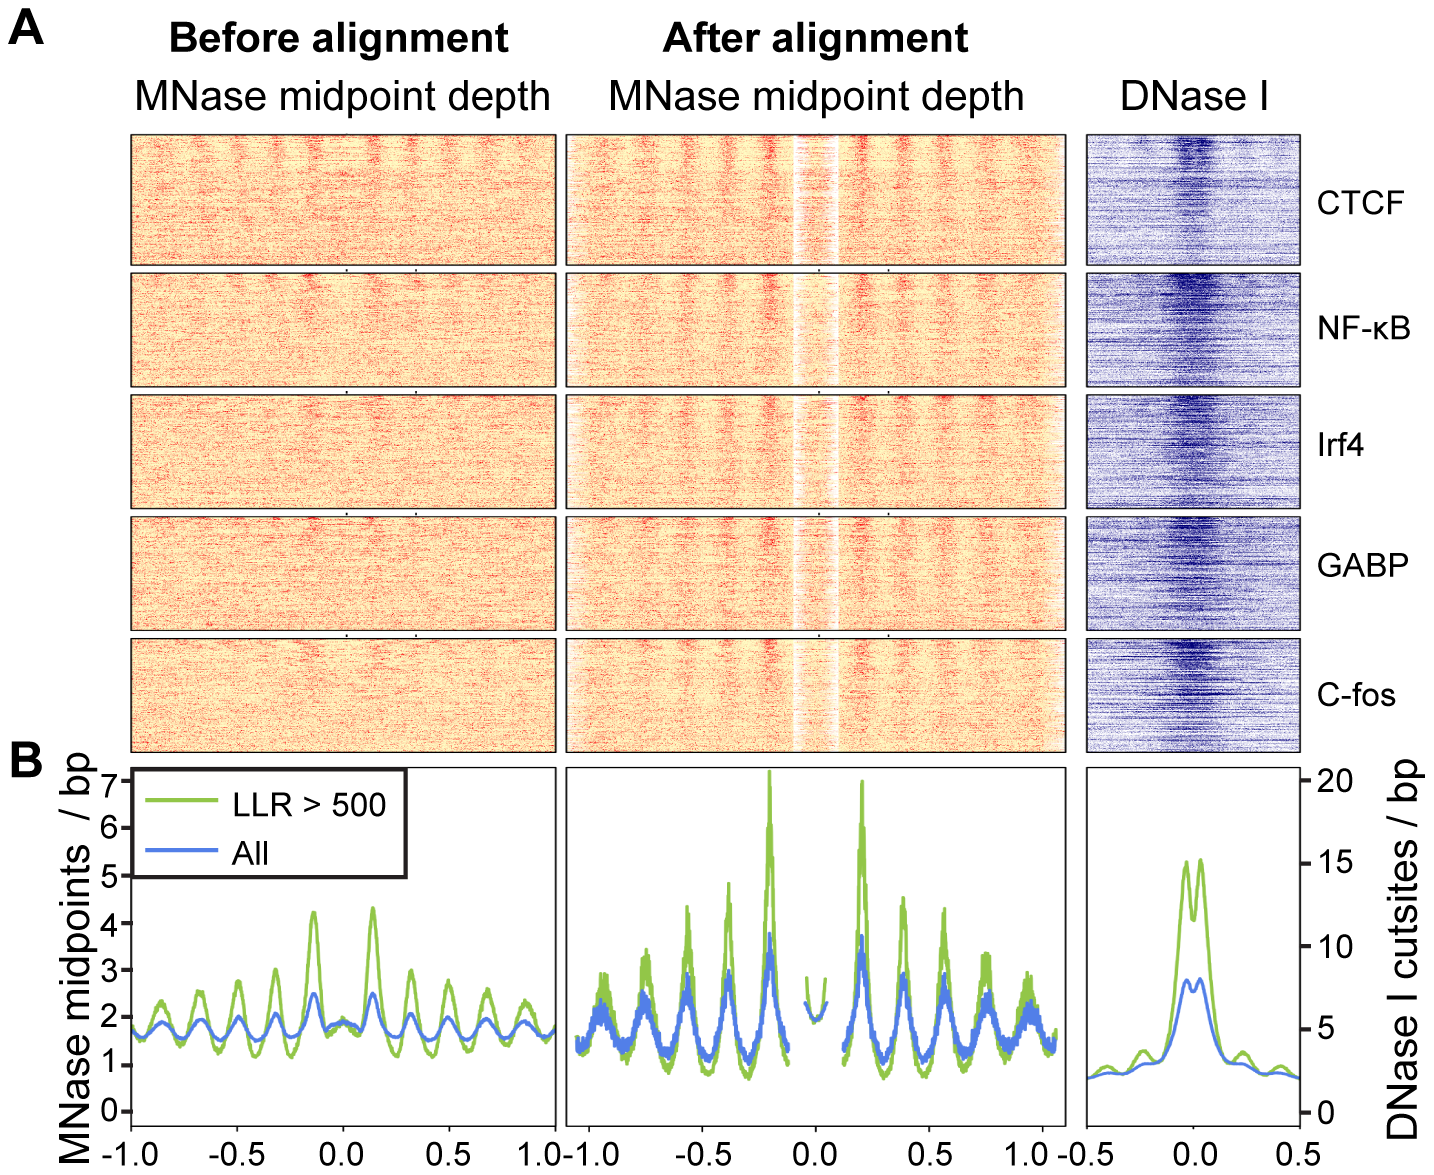
A. Heatmaps of MNase midpoints (columns 1–2) and DNase I cuts (column 3) surrounding 1000 randomly sampled ChIP-seq peaks for CTCF, NF-kB, Irf4, GABP and C-fos. Heatmap rows are ordered from top to bottom by the nucleosome array log likelihood ratio (LLR). B. Aggregation plot for MNase midpoint and DNase I cutsite depths across all regions and for the subset of regions with LLR>500.
ChIP partitioning method
In the current exercise we will use a probabilistic partitioning methods developed by our group to discover significant patterns in ChIP-Seq data [Nair et al., 2014]. Our methods take into account signal magnitude, shape, strand orientation and shifts. We have compared this methods with some of the existing methods and demonstrated significant improvements, especially with sparse data. Besides pattern discovery and classification, probabilistic partitioning can serve other purposes in ChIP-Seq data analysis.
In the current exercise we will exemplify its merits in the context of peak finding and partitioning of MNase patterns around human transcription factor NF-kB.
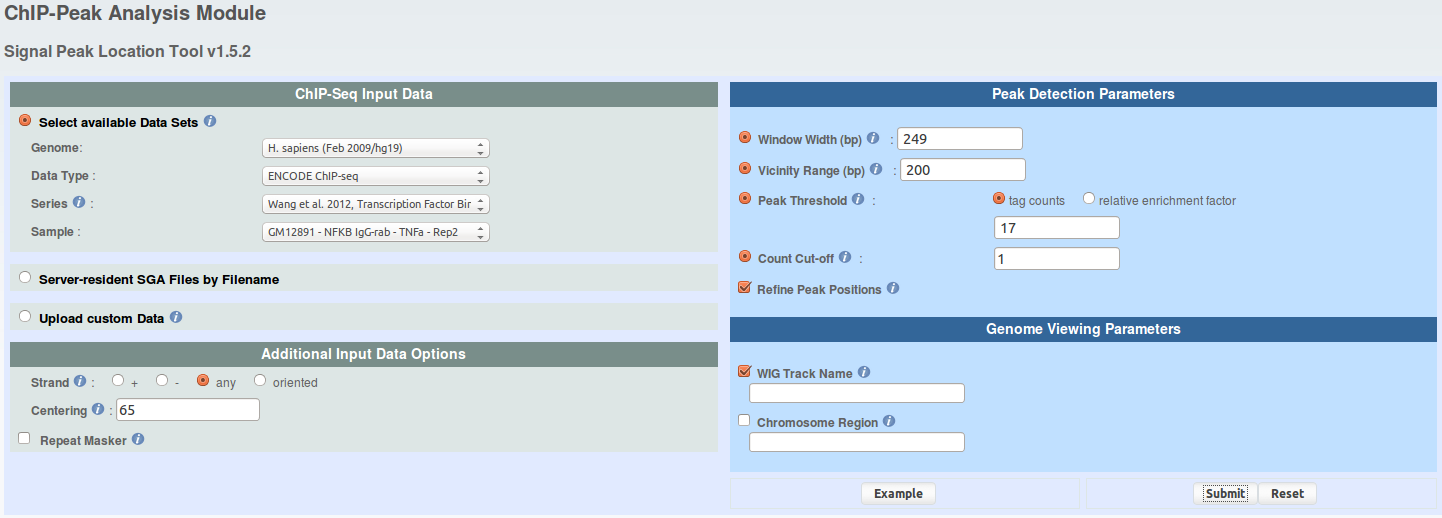
In order to identify patterns in MNase dataset around specific transcription factor, we will need two datasets.
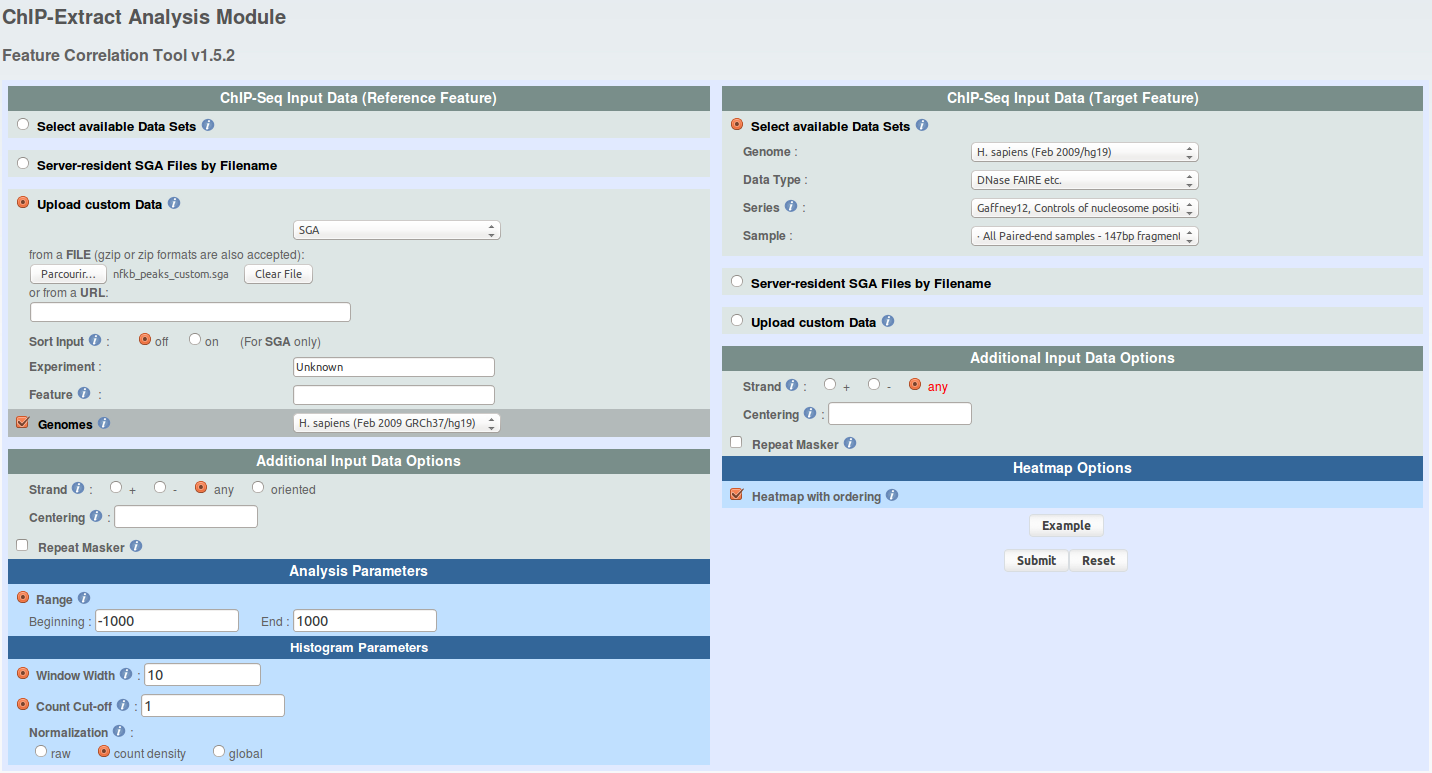
We will use ChIP-Extract Analysis Module to generate a tag count matrix in defined bins around NF-kB sites. Select the parameters as shown in the picture below and then click submit. In this case, no centering is used because the MNase data are paired-end.
Download the Ref SGA File and Table (TEXT) and save as mnase_data.txt.
Navigate into directory containing all the data and launch R.
em_shape_shift = function(c,q,data) { K=dim(c)[1]; L=dim(c)[2]; N=dim(data)[1]; S=dim(q)[2] l=array(dim=c(N,K,S)); p=array(dim=c(N,K,S)) for(i in 1:K) {c[i,]=c[i,]/mean(c[i,])} rm=matrix(nrow=N, ncol=S) for(k in 1:S) {rm[,k] = rowMeans(data[,k:(k+L-1)])} for(i in 1:N) { for (j in 1:K) { for (k in 1:S) { l[i,j,k]=sum(dpois(data[i,k:(k+L-1)], c[j,] *rm[i,k],log=T)) }}} for(i in 1:N) { p[i,,] = q*exp(l[i,,]-max(l[i,,])); p[i,,] = p[i,,]/sum(p[i,,])} q = apply(p, c(2,3), mean) c = 0; for(k in 1:S) { c = c + (t(p[,,k]) %*% data[,k:(k+L-1)])} c = c/apply(p, 2, sum) c <<- c; q <<- q; p <<- p; } reg_shift = function(q) { K=dim(q)[1]; S=dim(q)[2] m=sum((1:S)*colSums(q)) s=sum(((1:S)-m)**2*colSums(q))**0.5 for (i in 1:K) { q[i,] = sum(q[i,]) * dnorm(1:S,floor(S/2)+1,s) / sum(dnorm(1:S,floor(S/2)+1,s)) } q <<- q } plot_classes = function(c) { K=dim(c)[1] if(K == 1) {colors = "black"} else {colors = palette(rainbow(K))} for(i in 1:K) { if(i != 1) {par(new=T)} plot(c[i,], type = "l", ylim=c(0,max(c)), col=colors[i]) } }
data=as.matrix(read.table("mnase_data.txt"))Define classes and shifts:
K=1; S=11; N=dim(data)[1]; L=dim(data)[2]-S+1; ITER=10Shape based EM partitioning with shifting
mean_shift=floor(S/2)+1 c = colMeans(data[,mean_shift:(mean_shift+L-1)]) flat = matrix(data=mean(data), nrow=1, ncol=L) q=q0 = dnorm(1:S,mean_shift,1)/sum(dnorm(1:S,mean_shift,1)) for (m in 1:K) { c = rbind(flat,c) q = rbind(q0/m,q); q=q/sum(q) plot_classes(c); print(q) for(i in 1:ITER) {reg_shift(q); c[1,]=flat; em_shape_shift(c,q,data); plot_classes(c); print(q)} }
data_shifted = matrix(0, nrow=dim(data)[1], ncol=L) start=apply(p[,2,],1,which.max) for(i in 1:(dim(data)[1])) { data_shifted[i,] = data[i,start[i]:(start[i]+L-1)] } P=apply(p[,2,],1,sum) data_shifted=data_shifted[order(P),] P_shifted=sort(P)
library(zoo) # install package 'zoo' using install.packages("zoo") color <- colorRampPalette(c("white", "red"), space = "rgb")(100) x <- rollapply(data, width=20, mean, by=20, by.row=TRUE) y <- rollapply(data_shifted, width=20, mean, by=20, by.row=TRUE) layout(matrix(c(1,2,3,4), nrow=2, ncol=2), heights=c(1.5,1.5)) par(mar=c(0,5,0,0.5), oma=c(5,0,2,0)) image(t(x), col=color, xaxt="n", yaxt="n", bty="n") plot(seq(-990, 990, 10), colMeans(data), type="l", lwd=2, ylab="", xlab="", bty="n", ylim=c(0,0.4)) image(t(y), col=color, xaxt="n", yaxt="n", bty="n") plot(seq(-940, 940, 10), colMeans(data_shifted), type="l", lwd=2, ylab="", xlab="", bty="n",col="blue", ylim=c(0,0.4)) par(new=T) plot(seq(-940, 940, 10), colSums(data_shifted*P_shifted)/sum(P_shifted), type="l", lwd=2, ylab="", xlab="", bty="n",col="green", ylim=c(0,0.4)) legend("topleft", legend=c("class 1","ALL"), lty=1, col=c("green", "blue"), bty="n", lwd=c(5,5))