EPD's 40th Anniversary Symposium is open for registration !!! (click here)
(taking place in Geneva on Sep 4 2026, just after
ECCB 2026,
for more information, see https://epd.expasy.org/EPD_symposium2026/)
TSS assembly pipeline for MmNC_EPDnew_001
Introduction
This document provides a technical description of the transcription start site assembly pipeline that was used to generate EPDnewNC version 001 for M. musculus.Source Data
Promoter collection:
| Name | Genome Assembly | Promoters | Genes | PMID | Access data | ||
|---|---|---|---|---|---|---|---|
| Ensembl97 | March 2012 GRCm38/mm10 | 14704 | 10184 | 29155950 | SOURCE | DOC | DATA |
Experimental data:
| Name | Type | Samples | Tags | PMID | Access data | ||
|---|---|---|---|---|---|---|---|
| FANTOM5 | CAGE | 965 | 15,152,265,718 | 24670764 | SOURCE | DOC | DATA |
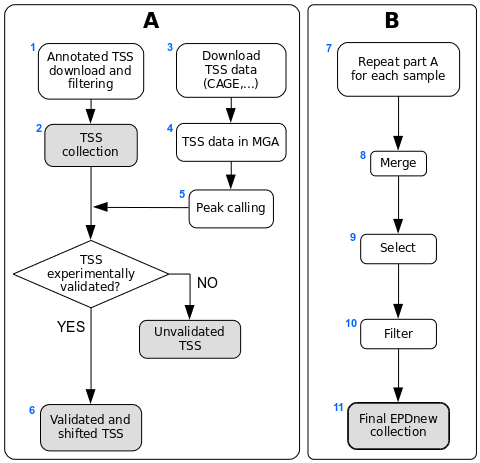
Assembly pipeline overview
|
Description of procedures and intermediate data files
1. Download of annotated promoters
Data was downloaded from BioMart. Genes were kept if the gene type was long intergenic non-coding RNA. All transcripts associated with any given gene were considered, but those with the same TSS position were merged under a common transcript ID. The resulting list contained 8685 TSSs covering 3496 genes.
2. Ensembl TSS collection
The Ensembl TSS collection is stored as a tab-delimited text file conforming to the SGA format. The six fields in the file contain the following information:
- NCBI/RefSeq chromosome id
- "TSS"
- position
- strand ("+" or "-")
- "1"
- Gene name.
3. Download of TSS mapping data
TSS mapping data was downloaded from the FANTOM5 http site (see link above). The source files are in BAM format mapped on the mm10 genome assembly. The complete list of files can be found here. BAM files were converted into BED files with the bamToBed program. Files were kept and analyzed individually.
4. MGA archive
The compressed versions of these files are available from the MGA archive (see links above).
5. Peak calling
Peak calling for each individual CAGE file was carried out using our ChIP-Peak online tool with the following parameters:- window width = 1
- vicinity range = 200
- peak refine = N
- count cutoff = 9999999
- threshold = 5
6. Ensembl TSS validation by TSS mapping data
Each sample was processed in a pipeline aiming at validating TSSs with CAGE peaks. An Ensembl TSS was experimentally confirmed if a peak lied in a window of 50 bp around it. The validated TSS was then shifted to the nearest base with the higher tag density.
7. Sample-specific promoter collection
Each sample in the dataset was used to generate a separate promoter collection. The same promoter could be validated in multiple samples and could have different start sites in different samples. To avoid redundancy, the individual collections were used as input for an additional step in the analysis (see part B in the figure above).
8. Merging collections
All sample-specific promoter collections were merged into a unique file and further analyzed. A promoter was retained in the list only if validated by at least 3 samples. Promoters validated by multiple samples may have their start site set on a broader region rather than a single position. For each transcript, we thus selected the position validated by the largest number of samples as the "true" TSS.
9. Further TSS selection
We used our ChIP-Peak online tool as above but with a vicinity of 150 and a threshold of 1, in order to retain the single most expressed promoter in each promoter "cluster".
10. Filtering
We finally applied an additional filtering on relative expression, keeping only promoters whose expression represents at least 10% of the associated gene's total expression. We also decided to limit the number of promoters per gene to 5.