EPDnew databases |
| EPDnew is a set of species-specific databases of experimentally validated promoters. Currently, 15 organisms are supported: 10 animals (H. sapiens, M. mulatta, M. musculus, R. norvegicus, G. gallus, C. familiaris, D. melanogaster, A. mellifera, C. elegans and D. rerio), 2 plants (A. thaliana and Z. mays), 2 fungi (S. cerevisiae and S. pombe) and 1 invertebrate (P. falciparum). Evidence comes from TSS mapping data generated from high-throughput experiments such as CAGE and Oligocapping. |
The number of promoters for each organism is the following:
|
Collection accessibility |
EPDnew databases are accessible in different ways:
|
Viewer Page |
| The viewer page contains information about a single entry in the database and provides various tools for the analysis of a promoter region. It is divided into several sections, each devoted to a single task. |
General InformationThis section provides information for the entry:
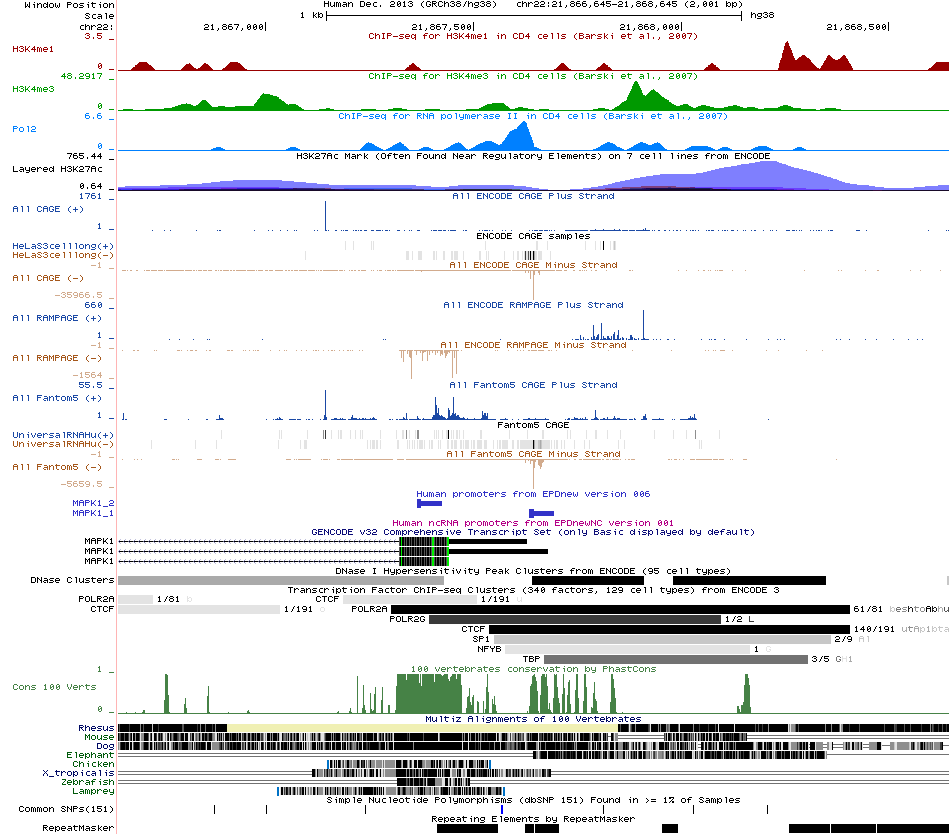
Promoter ImageThis section provides visual information about the genomic context of a promoter. The image is derived from the UCSC Genome Browser and can be reproduced by loading the EPDnew hub. It is designed to help scientists judge the quality of the annotated promoter.This is an example of a promoter image from the human promoter MAPK1_1: 
The image is conceptually divided into three sections:
Sequence Retrieval ToolThe sequence retrieval tool allows the extraction of sequence of any length around the annotated promoter. To extract a sequence, simply select the sequence range (in base pair) and click 'GET SEQUENCE'. The option 'lower case upstream TSS' outputs lowercase letters in the upstream region to facilitate the identification of the TSS within the sequence (the first uppercase letter in the sequence represents the TSS).Search Motif ToolThe search motif tool scans promoter regions with position weight matrices (PWM) of several transcription factors and core promoter elements to find putative binding sites. Once a PWM library and TF have been selected, it is possible to scan the region with that PWM. Hits are marked as red rectangles in the plot and exact positions relative to the TSS are reported below the plot. Motif libraries are from the JASPAR database and the EPD Promoter Elements and can be downloaded as text file here. A description of the motifs and the conversion rules can be found in our Motif Database homepage. The scan is performed on-the-fly using the FindM tool from the SSA toolkit.Expression Profile ToolThe expression profile tool shows the number of samples in which the promoter is active, its average expression level (number of tags in a 100-bp region centered on the TSS and normalized to 10M total tags) and a plot showing the distribution of sample-specific TSSs around the annotated TSS. Clicking on the histogram bars will show the number of samples that have the TSS located in that position (relative to the EPDnew annotated TSS) with their names and expression values.External ResourcesLinks to external genome browsers. |
References |
| The eukaryotic promoter database in its 30th year: focus on non-vertebrate organisms. Dreos, R., Ambrosini, G., Groux, R., Périer, R., Bucher, P. Nucleic Acids Res. (2017) 45:D51-55; PUBMED 27899657 |
Last update October 2019