TSS assembly pipeline for Sc_EPDnew_001
Introduction
This document provides a technical description of the transcription start site assembly pipeline that was used to generate EPDnew version 001 for S. cerevisiae genome assembly sacCer3.
Source Data
| Description | URLs |
| SGD genes | Source URL: https://genome.ucsc.edu/cgi-bin/hgTables?command=start
MGA data: /ftp/mga/sacCer3/sgd/sgdGenes.sga.gz |
| Park14 | Source URL: GEO series GSE49026
MGA doc: /ftp/mga/sacCer3/park14/park14.html MGA data: /ftp/mga/sacCer3/park14/ |
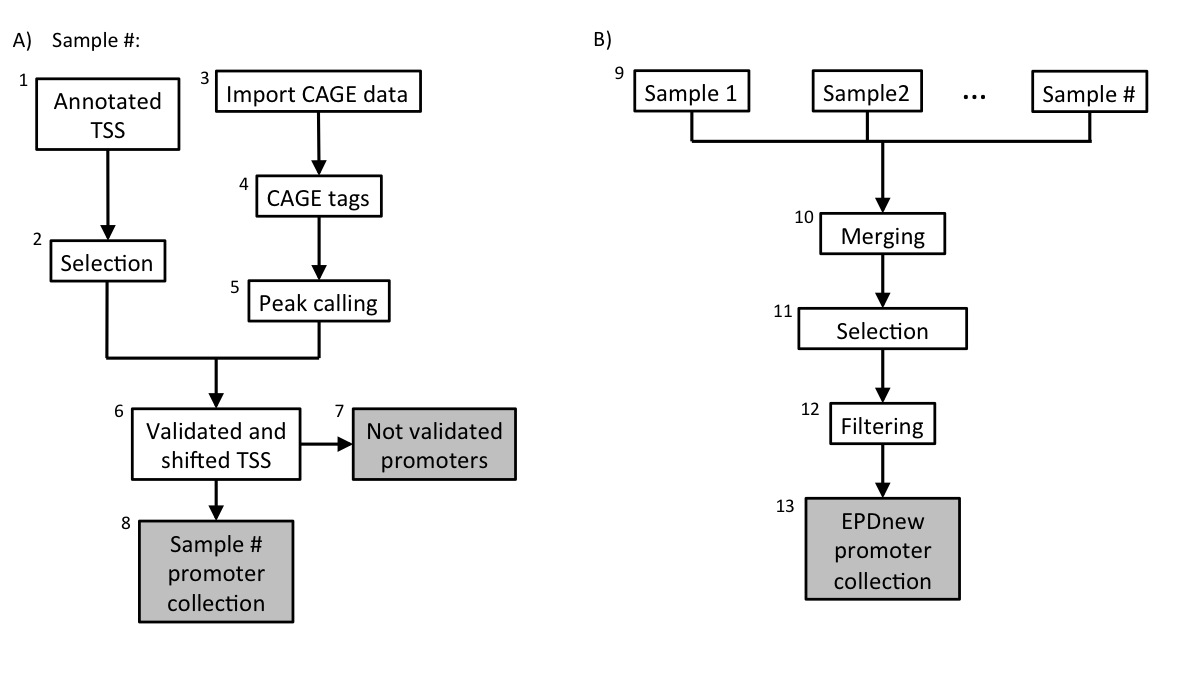
Assembly pipeline overview
|
Description of procedures and intermediate data files
1. Download annotated TSS
Data was downloaded from UCSC table browser the 02-02-2015. Transcrips have been filtered according to the following rules:- Transcripts of protein coding genes only
- Transcript lies on full chromosomes
- Genes must be annotated [Associated Gene Name present]
- Gene and transcripts status known
A total number of 6692 promoters were selected.
2. SGD TSS collection
The SGD TSS collection is stored as a tab-deliminated text file conforming to the SGA format under the name:-
sgdGenes.sga
- NCBI/RefSeq chromosome id
- "TSS"
- position
- strand ("+" or "-")
- "1"
- gene name
3. Import CAGE data
Data was imported from GEO as SRA file format. Raw sequence files were mapped to sacCer3 genome using Bowtie. The resulting BAM files were converted to SGA file format using ChIP-Convert.A step-by-step guide on how to import, map and convert these samples can be found here
5. mRNA 5' tags peak calling
For each individual sample (3), peak calling for the merged file has been carried out using ChIP-Peak on-line tool with the following parameters:- Window width = 200
- Vicinity range = 200
- Peak refine = Y
- Count cutoff = 9999999
- Threshold = 5
6. TSS validation and shifting
Each sample in the collection (mRNA peaks and UCSC TSS) was then separately processed in a pipeline aiming at validating transcription start sites with mRNA peaks. A UCSC TSS was experimentally confirmed if an mRNA peak lied in a window of 500 bp around it. The validated TSS was then shifted to the nearest base with the higher tag density.7. UCSC not-validated TSS
The total number (summing up all samples) of non experimentally validated TSS was around 3000.8. Promoter collection for each sample
Each sample in the dataset was used to generate a separate promoter collection. Potentially, the same transcript could be validated by multiple samples and it could have different start sites in different samples. To avoid redundancy, the individual collections were used as input for an additional step in the analysis (Assembly pipeline part B).9. Merging collections and second TSS selection
The 3 promoter collections were merged into a unique file and further analysed. Transcript validated by multiple samples could potentially have the TSS set on a broader region and not to single position. To avoid such inconsistency, for each transcript we selected the position that was validated by the larger number of samples as the true TSS.10. Filtering
Transcription Start Sites that mapped closed to other TSS that belonged to the same gene (500 bp window) were merged into a unique promoter following the same rule: the promoter that was validated by the higher number of samples was kept.10. Final EPDnew collection
The 4300 experimentally validated promoter were stored in the EPDnew database that can be downloaded from our ftp site. Scientist are wellcome to use our other tools ChIP-Seq (for correlation analysis) and SSA (for motifs analysis around promoters) to analyse EPDnew database.Last update October 2019