TSS assembly pipeline for Pf_EPDnew_001
Introduction
This document provides a technical description of the transcription start site assembly pipeline that was used to generate the EPDnew version 001 for P. falciparum.Source Data
Promoter collection:
| Name | Genome Assembly | Promoters | Genes | PMID | Access data | ||
|---|---|---|---|---|---|---|---|
| EnsemblProtists40 genes | Apr 2016 ASM276v2/pfa2 | 5286 | 4994 | 29092050 | SOURCE | DOC | DATA |
Experimental data:
| Name | Type | Samples | Tags | PMID | Access data | ||
|---|---|---|---|---|---|---|---|
| adjalley16 | CAGE | 12 | 40,054,976 | 26947071 | SOURCE | DOC | DATA |
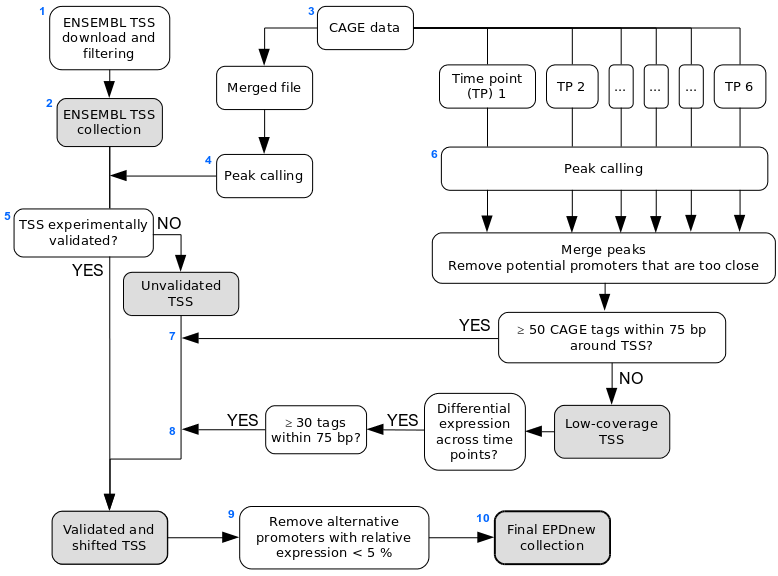
Assembly pipeline overview
|
Description of procedures and intermediate data files
1. ENSEMBL Download
Data was downloaded from EnsemblProtists release 40 in October 2018. Only transcrips from protein coding genes have been selected.5362 of 5693 genes originally present in the ENSEMBL database were retained after this filtering. Transcripts with the same TSS position were then merged under a common ID, yielding 5286 uniquely mapped promoters in the TSS collection.
2. ENSEMBL TSS collection
The ENSEMBL TSS collection is stored as a tab-delimited text file conforming to the SGA format under the name:-
Pf_ensembl40_tss_pfa2.sga
- NCBI/RefSeq chromosome id
- "TSS"
- position
- strand ("+" or "-")
- "1"
- ENSEMBLGeneID..geneName
3. Data import from FTP at GEO
BEDGRAPH files for the 12 CAGE samples were downloaded from NCBI GEO ftp site (see link above). Files were then converted into SGA format using in-house software. Individual SGA files can be downloaded from our ftp website (see link above).4. CAGE tag peak calling
A first selection of strong promoters was done based on a merged file containing tags from all time points and replicates, using the ChIP-Peak, and ChIP-Cor online tools. ChIP-Peak was used with the following parameters:- window width = 1
- vicinity range = 150
- refine peak positions = Y
- count cutoff = 9999999
- threshold = 10
5. TSS validation and shifting
Each of the TSSs in the ENSEMBL collection was then validated and shifted if at least one peak from the previous step was found between 1000 bp upstream and the TSS position. This yielded a preliminary collection of 4015 promoters.6. CAGE tag peak calling (second round)
A second selection was done using ChIP-Peak on merged files of the duplicates from each time point, with the same parameters as above but a lower threshold. After merging, peaks too close from one another were removed using ChIP-Peak with the same parameters as above but a threshold of 0. TSSs with < 50 tags in a 150-bp centered window were excluded.7. TSS validation and shifting (second round)
Unmatched ENSEMBL TSSs from step 5 were validated and shifted as above using the peaks obtained in step 6, yielding 1580 promoters, which were added to the preliminary collection.8. Addition of differentially expressed promoters
Low-coverage TSSs from step 6 (< 50 tags) that had at least 30 tags within 75 bp around the TSS and that showed differential expression across time points (defined as more than 50% of tags at a single time point) were validated against ENSEMBL TSSs as above, yielding 134 additional promoters.9. Filtering by relative expression
For genes with several potential promoters, we filtered out those representing < 5% of the tags from all promoters associated with the corresponding gene.10. Final EPDnew collection
The 5597 experimentally validated promoters were stored in the EPDnew database, which can be downloaded from our ftp site. Scientists are welcome to use our other tools ChIP-Seq (for correlation analysis) and SSA (for motif analysis around promoters) to analyze the EPDnew database.Last update October 2019