TSS assembly pipeline for Dm_EPDnew_005
Introduction
This document provides a technical description of the transcription start site assembly pipeline that was used to generate EPDnew version 005 for D. melanogaster.
Source Data
Promoter collection:
| Name | Genome Assembly | Promoters | Genes | PMID | Access data | ||
|---|---|---|---|---|---|---|---|
| ENSEMBL86 | Aug 2014 BDGP Rel6 + ISO1 MT/dm6 | 18409 | 13660 | 19420058 | SOURCE | DOC | DATA |
Experimental data:
| Name | Type | Samples | Tags | PMID | Access data | ||
|---|---|---|---|---|---|---|---|
| MachiBase | OligoCap | 7 | 24,984,353 | 18842623 | SOURCE | DOC | DATA |
| Hoskins et al., 2012 | CAGE | 1 | 17,979,809 | 21177961 | SOURCE | DOC | DATA |
| modENCODE | CAGE | 49 | 596,317,845 | 24985915 | SOURCE | DOC | DATA |
| Ni et al., 2010 | CAGE | 2 | 27,173,616 | 20495556 | SOURCE | DOC | DATA |
| Schor et al., 2017 | CAGE | 316 | 2,536,326,545 | 28191888 | SOURCE | DOC | DATA |
Assembly pipeline overview
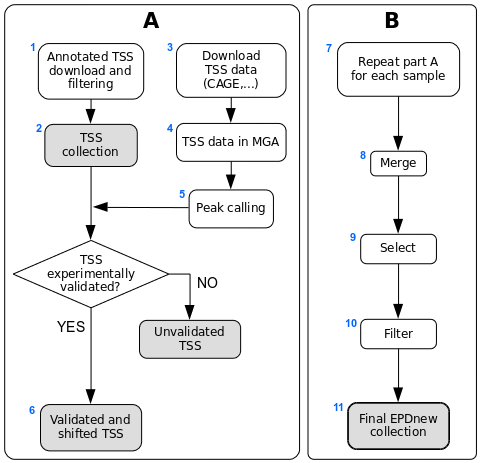
|
Description of procedures and intermediate data files
1. Biomart Download
Data was downloaded from BioMart, selecting the following attributes:
- Ensembl Gene ID
- Ensembl Transcript ID
- Chromosome Name
- Strand
- Transcript Start (bp)
- Transcript End (bp)
- Gene Start (bp)
- Gene End (bp)
- Status (transcript)
- Status (gene)
- Associated Gene Name
Then, transcripts have been filtered according to the following rules:
- Transcripts of protein coding genes only
- Transcript length > 0 [Transcript Start different from Transcript End]
- Transcript lies on full chromosomes
- Gene must have a 5' UTR [Transcript Start different from Gene Start]
- Genes must be annotated [Associated Gene Name present]
- Genes' and transcripts' status known
Gene names were taken from the field 'Associated Gene Name'. Since the EPD format does not allow gene names longer than 18 characters, we checked whether the names respected this limitation.
Transcripts with the same TSS position were merged under a common ID. As a conseguence of this, from the 23850 transcripts originally present in the ENSEMBL database, 5953 were merged, leaving 17897 uniquely mapped promoters in the input list.
2. EMBL TSS collection
The ENSEMBL TSS collection is stored as a tab-deliminated text file conforming to the SGA format under the name:
- Dm_ENSEMBL86.sga
The six fields contain the following information:
- NCBI/RefSeq chromosome id
- "TSS"
- position
- strand ("+" or "-")
- "1"
- gene name.
Note that the second and forth fields are invariant.
3. Data import
Machibase
MachiBase data were generated with the oligo-capping technology. The source data were downloaded from:
According to the readme file included in the tar archive, the 5' end tags were mapped to the Drosophila genome using BLAT as alignment tool allowing for up to three mismatches.
Genome Research
Mapped sequence tags were extracted from Supplementary Data File 1 available from Genome Research at:
The downloaded source file is in SAM format and has been generated with the tag mapping program StatMap as described in the article cyted above. We extracted all tags with mapping quality scores greater than or equal to 30.
SRA
BAM files for the SRA serie SRP001602 and SRX018832 were downloaded from SRA site and converted into SGA file using in-house software.
ArrayExpress
FASTQ files for the ArrayExpress serie E-MTAB-4787 were downloaded from ENA site and mapped to the genome with bowtie. File convertion into SGA format was performed using standard software. A ditailed description of the procedures involved can be found in the documentation.
4. oligocap and CAGE tags
The compressed version of these files is available from the MGA archive (see above) under the names:
- all_oligocap.sga.gz
- embryo_cage.sga.gz
5. Peak calling
Peak calling for each individual oligocap and CAGE data file has been carried out using ChIP-Peak on-line tool with the following parameters:
- Window width = 1
- Vicinity range = 200
- Peak refine = N
- Count cutoff = 9999999
- Threshold = 5
6. TSS validation and shifting
Each sample in the collection (mRNA peaks and ENSEMBL TSS) was then processed in a pipeline aiming at validating transcription start sites with mRNA peaks. An Ensembl TSS was experimentally confirmed if a CAGE peak lied in a window of 200 bp around it and if it had a maximum high of at least 3 tags. The validated TSS was then shifted to the nearest base with the highest tag density.
7. Promoter collection for each sample
Each sample in the dataset was used to generate a separate promoter collection. Potentially, the same transcript could be validated by multiple samples and it could have different start sites in different samples. To avoid redundancy, the individual collections were used as input for an additional step in the analysis (part B in the assembly pipeline overview).
The quality of each sample-specific promoter colection was based on the density distribution of known core promoter elements at the expected positions. A TATA-box score was evaluated as the density distribution of the lement at position -29 from the TSS and an Initiator score as the density disribution at the TSS. Samples with very low scores (outliers) were discarded from the pool.
8. Merging collections
All promoter collections were merged into a unique file and further analyzed with the exception of samples from Schore et al., 2017. Since the promoter of a transcript was maintained in the list only if validated by at least two samples and since the position validated by the largest number of samples was selected as EPDnew promoter, there would have been an inbalance in TSS selection given the large number of samples in Schore et al. (2017) coming from only 3 developmental stages. For this reason, in order to reduce the inpact of these developmental stages in TSS selection, we first generated developmental stage-specific TSS collections and merged these with the remaining samples from the other sources.
9. Second TSS selection
A further selection was applied to choose the promoter position validated by the largest number of samples.
10. Filtering
TSSs that mapped close to other TSSs belonging to the same gene (200-bp window) were merged into a unique promoter following the same rule: the promoter that was validated by the highest number of samples was retained.