ChIP-Seq Analysis Tutorial

Part 3

STAT1

In this section, we will describe the following applications:

C. Using ChIP-Seq programs with genome annotations

We have seen so far how the ChIP-Seq tools can be used in combination with other DNA motif analysis programs, in particular the SSA motif analysis platform, to carry out more advanced analysis tasks.
The ChIP-Seq server also features a collection of so-called genome annotation files, including transcription start sites collections, which are primarily used as input to the ChIP-Cor tool.

In this section we are going to illustrate four typical application examples:

1. Cross-genome conservation of STAT1 binding sites

For this study, we will use the Robertson G et al., 2007 data set for in vivo STAT1 binding sites in γ-interferon stimulated HeLa cells that can be accessed as a server-resident file at the ChIP-Seq server.

We want to asses whether in vivo occupied STAT1 sites are functional or not by measuring the degree of cross-genome sequence conservation across releated species.
To allow for this type of analysis, the ChIP-Seq server offers as server-resident file, a compact SGA-formatted version of the PhastCons genome conservation track from the UCSC genome browser database.

We will first use ChIP-Peak to generate a STAT1 peak list:

  • On the left side under the header ChIP-Seq Input Data activate the checkbox Select available Data Sets and select:
    • Genomes : H.sapiens (March 2006/hg18).
    • Data Type : ChIP-seq.
    • Series : Robertson 2007, HeLa S3 cells, Genome-wide STAT1 profiles.
    • Sample : STAT1 stim will automatically display.
  • On the left side under the header Additional Input Data Options make sure that you select the
    any Strand option for selecting both strands.
  • Activate centering option for all reads tags by filling in value 70.
  • On the right side under the header Peak Detection Parameters select the following values:
    • Window width (w) : 200 bp.
      It defines the integration range for tag counts.
    • Vicinity Range (v) : 200 bp.
      It defines the minimal distance (in bp) between two local peaks.
    • Peak Threshold (t) : 30 counts.
    • Count Cut-off : 1
    • Activate the Refine Peak Positions checkbox.
      It computes more accurate peak location coordinates.

ChIP-Peak reports a total of 7932 STAT1 peaks.

We save the peak list both in SGA (stat1_th30_chip_peak.sga) and FPS formats (stat1_th30_chip_peak.fps) so as to be able to upload it to the FindM program of the SSA server in order to generate a new list containing the genomic coordinates of STAT1 consensus sequences occurring within 100 bp from a peak center position. The program FindM (Find Motifs) detects motifs which preferetially occur at a constrained distance from a functional site, for instance a transcription initiation site or a TF binding site.

Go to FindM and follow the instructions below:

  • On the left side under the header Sequence Input activate the checkbox Upload FPS File by selecting the previously downloaded peak regions (stat1_th30_chip_peak.fps).
  • Optionally, you can fill in the FPS name field with STAT1
  • On the left side under the header Sequence Search Range select values -100 and 100 for the 5' and 3' borders respectively.
  • On the right side under the header Signal Description make sure that
    • the checkbox Consensus sequence is activated.
    • Erase the contents of the large text window.
    • Enter the sequence "TTCNNNGAA".
      Optionally, you can change the Name of the consensus sequence as well (with STAT1).
  • Set Reference Position : 5
    The program scanning procedure is based around the center of the motif.
  • Under Cut-off value activate the checkbox mismatches and fill in value 0
  • Select Sequence Output : FPS

You are now ready to submit the job.

We save the list of 2870 STAT1 consensus sequences extracted by FindM (findm_stat1_p.fps) and we then upload it as reference feature to the ChIP-Cor tool in order to generate the sequence conservation profile.

Go to the program ChIP-Cor and do the following:

  • On the left side under the header ChIP-Seq Input Data (Reference Feature) activate the checkbox Upload custom Data
    and select the format of the file you want to upload (choose FPS).
    • Upload the FPS file containing the previously downloaded STAT1 consensus sequences:
      • FPS file : findm_stat1_p.fps
      • Select the species assembly H.sapiens (Mar 2006 NCBI36/hg18) by means of the Genomes checkbox
      • Optionally, you can fill in Experiment with STAT1 consensus sequences
  • On the left side under the header Additional Input Data Options make sure you also select
    • Strand any
  • On the right side under the header ChIP-Seq Input Data (Target Feature) select
    • Genomes : H.sapiens (March 2006/hg18)
    • Data Type : Sequence-derived
    • Series : PhastCons Vert17, Genome Conservation Scores
    • Sample : PHASTCONS VERT17
  • On the right side under the header Additional Input Data Options make sure you also select
    • Strand any
  • On the input form under the header Analysis Parameters select the following values:
    • Range. Fill in the followng values: Beginning: -1000, End: 1000
    • Window width : 10
    • Count Cut-off : 10
    • Under Normalization select the count density checkbox.

In the resulting sequence conservation profile, we observe a sharp peak centered at position zero surrounded by a larger region of increased sequence conservation, suggesting that in vivo bound STAT1 sites are indeed conserved across species, and in addition tend to occur as parts of larger conserved regulatory regions of up to 300 bp:
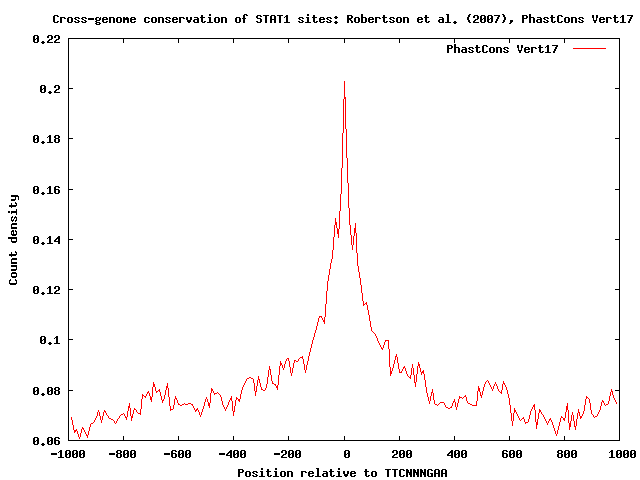
ChIP-Seq Output


2. Enrichment of STAT1 binding sites in promoter regions

Another interesting topic for biologists is whether in vivo STAT1 binding sites preferentially occur in promoter regions. The ChIP-Seq server offers several transcription start site collections as server-resident files.
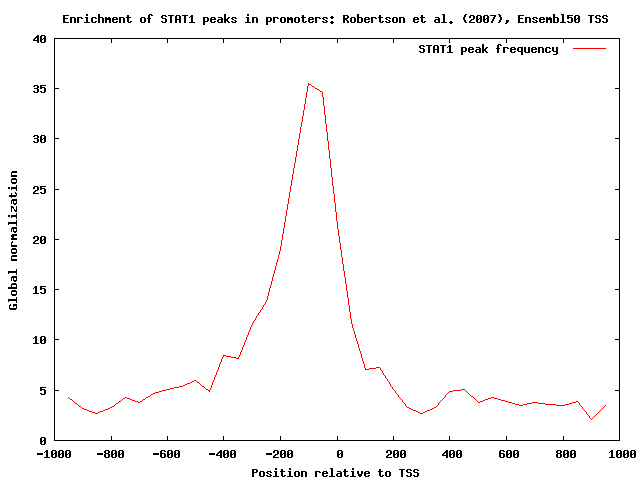
So, using the ChIP-Cor tool, we could easily correlate the STAT1 peak centers previously found by ChIP-Peak with transcription start site (TSS) positions to plot the STAT1 peak frequency relative to TSS.

We select the Ensembl TSS collections as reference feature, and upload the SGA-formatted output from ChIP-Peak as target feature to the ChIP-Cor tool, as follows:

  • On the left side under the header ChIP-Seq Input Data (Reference Feature) make sure that the checkbox Select available Data Sets is activated.
    Select:
    • Genomes : H.sapiens (March 2006/hg18)
    • Data Type : Genome Annotation
    • Series : ENSEMBL52, TSS collection
    • Sample : TSS from ENSEMBL 52
  • On the left side under the header Additional Input Data Options make sure you also select
    • Strand oriented
  • On the right side under the header ChIP-Seq Input Data (Target Feature) activate the checkbox Upload Custom Data
    by selecting the format : SGA
  • Alternatively, you can upload the FPS file: (stat1_th30_chip_peak.fps) In this case you should remember to select FPS as a format
  • Select the species assembly H.sapiens (Mar 2006 NCBI36/hg18) by means of the Genomes checkbox
  • Optionally, you can fill in Experiment with STAT1 peaks, and Feature with STAT1_p
  • On the right side under the header Additional Input Data Options make sure you also select
    • Strand any
  • On the input form under the header Analysis Parameters select the following values:
    • Range. Fill in the followng values: Beginning: -1000, End: 1000
    • Window width : 50
    • Count Cut-off : 10
    • Under Normalization select the global checkbox.
      It displays the target feature abundance as fold change relative to the genome average

Note that we have selected the global normalization mode, which displays the target feature abundance as fold change relative to the genome average.
The result of this analysis shows that in vivo bound STAT1 binding sites are indeed strongly over-represented in promoter regions:
ChIP-Seq Output


3. Nucleosome positioning and gene expression

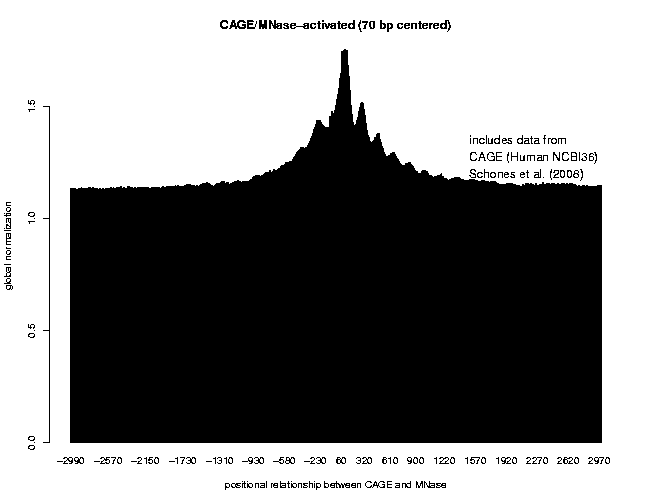
To examine the relationship between the positioning of nucleosomes and transcriptional activity, we can use ChIP-Cor to correlate Cap Analysis Gene Expression (CAGE) tag data (T. Shiraki et al., 2003 and R. Kodzius et al., 2006) with genome-wide maps of nucleosome positions in both resting and activated human CD4+ T cells from DE. Schones et al., 2008. Both sets of data are available on our ChIP_Seq Web Server site as server-resident files.
It is known that the positioning of nucleosomes with respect to DNA plays an important role in regulating transcription and only very recently genome-wide studies of regulation of nucleosome phasing made it possible to correlate transcriptional activation or repression with nucleosome reorganization.

To show an example of such results, we are going to use the ChIP-Cor tool to compare nucleosome profiles from Schones et al. with the CAGE data.

Go to ChIP-Cor and follow the instructions below:

  • On the left side under the header ChIP-Seq Input Data (Reference Feature) make sure that the checkbox Select available Data Sets is activated.
    Select:
    • Genomes : H.sapiens (March 2006/hg18)
    • Data Type : RNA-seq
    • Series : FANTOM4, Functional Annotation of the Mammalian Genome using deepCAGE
    • Sample : CAGE Human
  • On the right side under the header ChIP-Seq Input Data (Target Feature) make sure that the checkbox Select available Data Sets is activated.
    Select:
    • Genomes : H.sapiens (March 2006/hg18)
    • Data Type : DNase FAIRE etc.
    • Series : Schones 2008, CD4+ cells, nucleosome profiling, GSE10437
    • Sample : CD4+ Activated Nucleosomes to select nucleosome positions in activated human CD4+ T cells.
  • On both the left and right sides under the header Additional Input Data Options make sure that you select:
    • Strand : oriented for the Reference (i.e. CAGE) tags
      Requiring oriented strand processing means reverting the chromosome axis when the reference feature is on the '-' strand. This is because TSS positions are oriented and we want to compute relative tag distances in an oriented manner.
    • Strand : any for the Target (i.e. Schones) tags
    • centering : 70 for the Target feature tags
      Schones et al. data have nucleosome resolution.
  • On the input form under the header Analysis Parameters select the following values:
    • Range (it defines the relative distance between forward and reverse sequence tags reads).
      Fill in the followng values: Beginning: -3000, End: 3000
    • Window width : 10
      It defines the histogram step size.
    • Count Cut-off : 1
      We count as one multiple reads that map to the same start location and orientation (since we believe
      that these are likely due to PCR bias).
    • Under Normalization options select the global checkbox.
      The histogram displays the target feature abundance as fold change relative to the genome average

You are now ready to submit the job.

The correlation plot is the following:
ChIP-Seq Output


Save the ChIP-Cor output file in text format (CAGE_Schones_Act_chipcor.out):

Now run ChIP-Cor for the nucleosome profile in resting CD4+ T cells from Schones et al. (hint: select feature MNase resting).

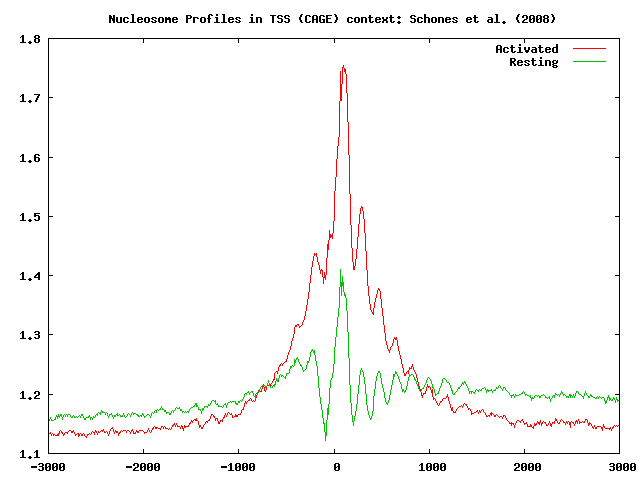
Save the ChIP-Cor output file in text format as before (CAGE_Schones_Rest_chipcor.out) and plot both output files for activated and resting T cells respectively (using gnuplot for instance):
ChIP-Seq Output

As we can see from these results, the nucleosomes near the TSS of expressed genes are phased with respect to the TSS, and that T cell activation induces nucleosome reorganization. Our data indicate that the nucleosome level does not show a big change in the region upstream of the TSS, whereas we observe a significant increase in the +1 and +2 nucleosome levels downstream of the TSS. This observation is in agreement with what has been found by Schones et al., 2008.

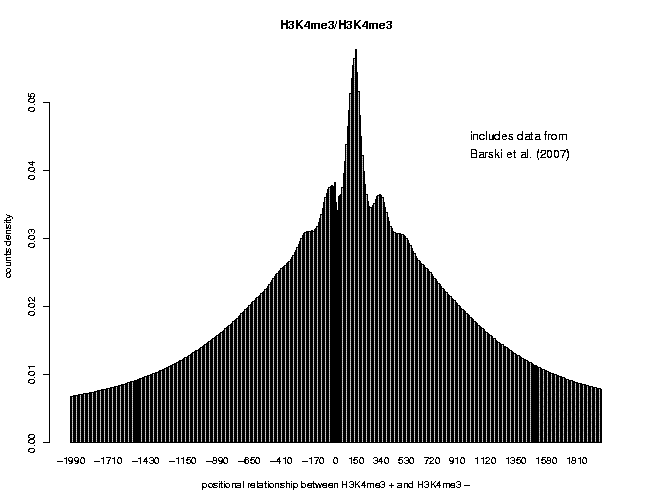
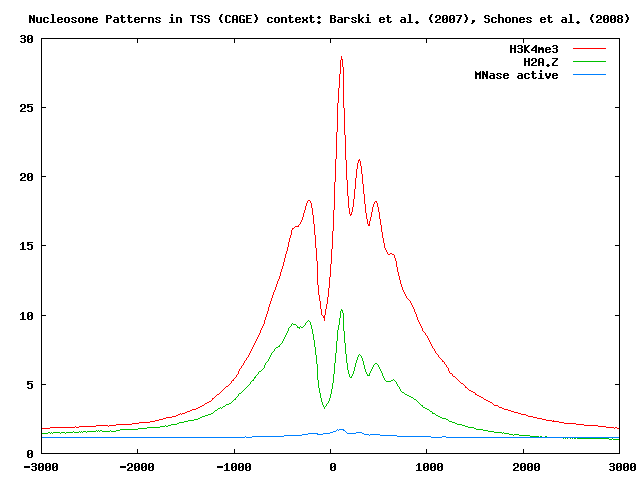
We previously analyzed (tutorial part 2) the genome-wide distribution patterns of histone methylation in human CD4+ cells using ChIP-Seq (Barski et al., 2007). We observed that the H3K4me3 profiles displayed several subpeaks, each spanning approximately 150 bp, suggesting that these short sequence reads may elucidate nucleosome positions:
ChIP-Seq Output

Try now to study H2A.Z deposition and H3K4me3 modification in promoter regions, as we have shown in the example above, to show how they may facilitate nucleosome eviction or repositioning in promoter regions of the human genome.

The figure below shows different nucleosome positioning patterns around TSSs:
ChIP-Seq Output


The results of this analysis show that nucleosome positioning is indeed correlated with gene expression activity.


4. Localization Analysis of H3K4me1 domain boundaries

In this section, we will try to show how the ChIP partitioning tool ChIP-Part, used in conjuction with the correlation tool ChIP-Cor, can be useful for analysing in more detail genome-wide histone modification patterns and co-localizing them with other significant epigenetic properties.

To this purpose, we choose H3K4me1, which is known to be active in transcription initiation, and we start be extracting H3K4me1 boundaries across the human genome by means of ChIP-Part.

Go to the program ChIP-Part and procede as follows:

  • On the left side under the header ChIP-Seq Input Data activate the checkbox Select available Data Sets and select:
    • Genomes : M.sapiens (March 2006/hg18).
    • Data Type : ChIP-seq.
    • Series : Barski 2007, CD4+ cells, histone marks.
    • Sample : CD4+ H3K4me1.
  • On the left side under the header Additional Input Data Options make sure that you select the
    any Strand option for selecting both strands.
  • Activate Centering option by filling in value 70
  • Activate Repeat Masker to filter out interspersed repeats and low complexity DNA regions.
  • On the right side under the header Partitioning Parameters select the following values:
    • Count Density Threshold (t) : 0.005 bp.
      It defines the threshold in count density for defining signal-rich regions (remember that the average count densities in regions outside peaks is 0.007)
    • Transition Penalty (p) : -10 bp.
      It assigns a (negative) score to a transition from signal-rich to signal-poor region.
    • Count Cut-off : 1
  • On the right side under the header Genome Viewing Parameters set the following values:
    • BED Track Name : ChIP-Part-H3K4me1-barski (for example)

The analysis revealed 35241 H3K4m1-modified regions. Save both the partitioning statistics and the SGA-formatted file:

   ChIP-Part-H3K4me1.sga
   ChIP-Part-H3K4me1.stats.txt

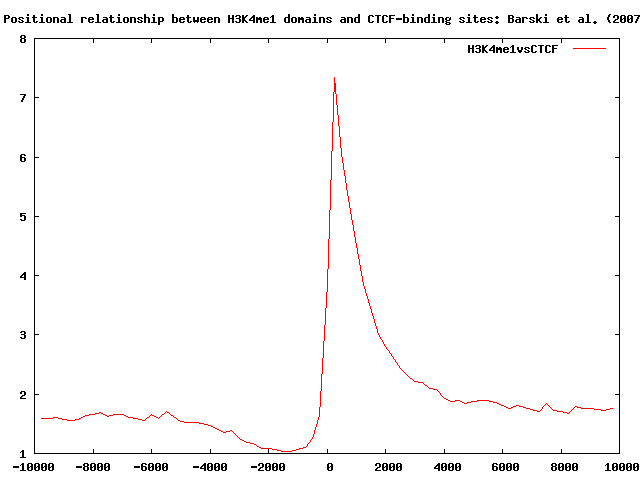
Using ChIP-Cor we now search for H4K3me1 domain boundaries (edges of H3K4me1 domains) that occur near CTCF-binding sites, and H3K4me3 marks. For completeness, we also look at cross-genome conservation maps around H3K4me1 domain boundaries.

Go to ChIP-Cor and follow the instrauctions below:

  • On the left side under the header ChIP-Seq Input Data (Reference Feature) activate the checkbox Upload custom Data
    and select the format of the file you want to upload (choose SGA).
    • Upload the SGA file containing the H3K4me1 domain boundaries:
      • SGA file: ChIP-Part-H3K4me1.sga
      • Select the species assembly H.sapiens (Mar 2006 NCBI36/hg18) by means of the Genomes checkbox
      • Optionally, you can fill in Experiment with Barski, and Feature with H3K4me1
        STAT1_p is the name that appears in the second field of the SGA file you are uploading. If you leave this latter blank, all peaks will be anyway selected (the original feature name will be replaced by CHIP_R and this name will appear in your correlation plot).
    • On the left side under the header Additional Input Data Options make sure you also select:
      • Strand oriented
      • On the right side under the header ChIP-Seq Input Data (Target Feature) select:
        • Genomes : M.sapiens (March 2006/hg18).
        • Data Type : ChIP-seq.
        • Series : Barski 2007, CD4+ cells, histone marks.
        • Sample : CD4+ CTCF
      • On the right side under the header Additional Input Data Options make sure you also select:
        • Strand any (you select all ChIP-Seq tags)
        • and activate Centering option by filling in value 35.
          (All tags are shifted by 35 bp to their estimated DNA fragment centers).
      • On the input form under the header Analysis Parameters select the following values:
        • Range. Fill in the followng values: Beginning: -10000, End: 10000
        • Window width : 250
        • Count Cut-off : 10
        • Under Normalization select the global checkbox.

The histogram shows a sharp peak at about 250 bps:
ChIP-Seq Output


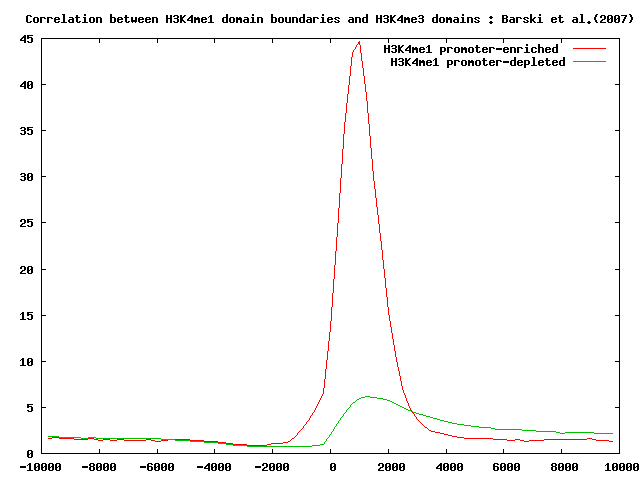
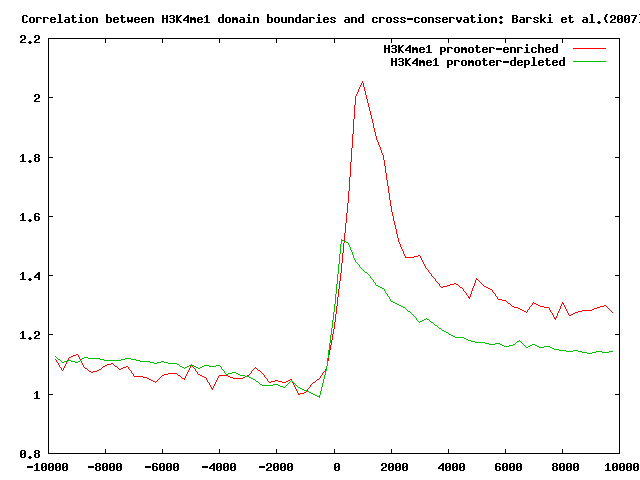
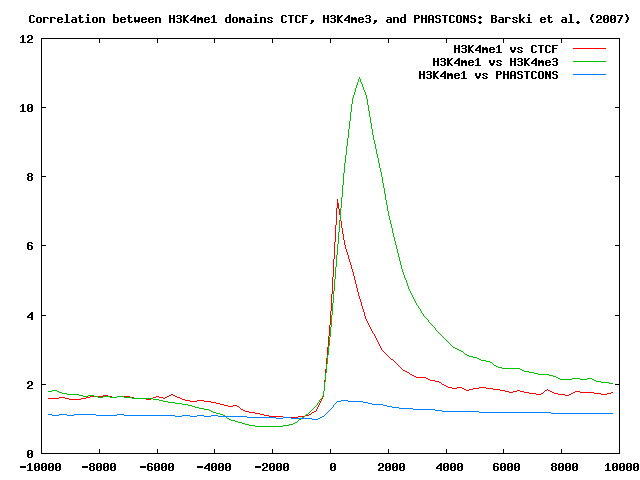
Similarly, we can correlate H3K4me1 domain boundaries with H3K4me3 tag maps and cross-genome conservation scores.

Here below is a summary of the results:
ChIP-Seq Output


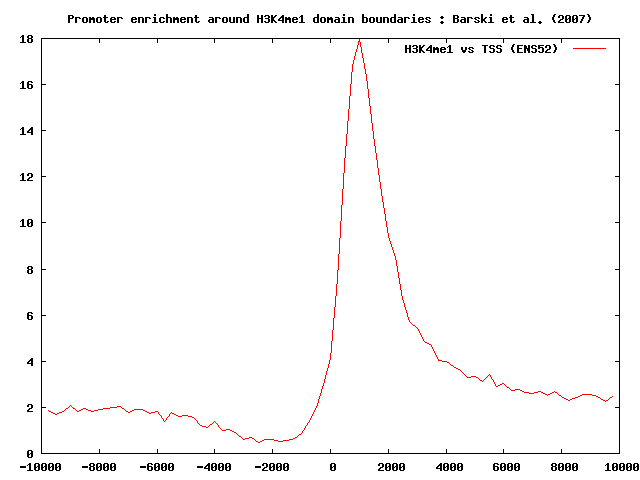
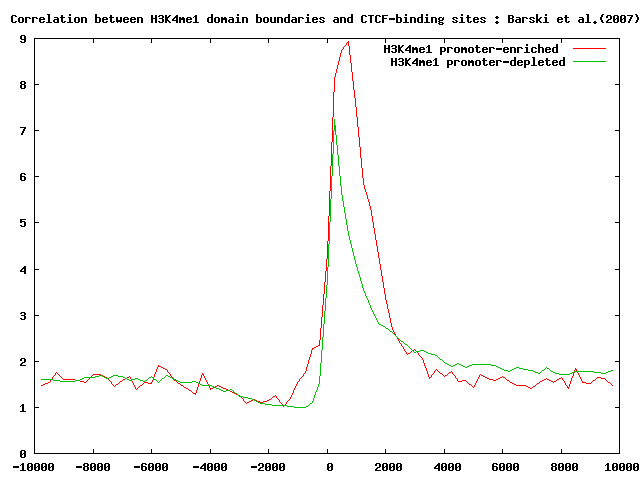
We now split the H3K4me1 chromatin domains into two different sets: promoter-enriched and promoter-depleted H3K4me3 boundaries. To do this, we should proceed as follows.

We first run ChIP-Cor to correlate H3K4me1 domain boundaries with a list of annotated promoters from the ENSEMBL52 set. We then use the Feature Extraction tool to select H3k4me1 boundaries with at least 1 transcription initiation site between -1000 bp and 2000 bp. We activate the depleted feature extraction checkbox to extract the promoter-depleted set. The promoter-enriched set contains 8925 domain boundaries whereas the promoter-depleted set contains 61557 sites:

   ChIP-Cor-H3K4me1_TSS_ENS52_enriched.sga
   ChIP-Cor-H3K4me1_TSS_ENS52_depleted.sga
ChIP-Seq Output


It's interesting to look at the localization of CTCF-binding sites, H3K4me3 and PHASTCONS conservation scores in both the previously selected sets.

Perform the correlation analysis as indicated above.

Here below you can see the summary results.

ChIP-Seq Output


ChIP-Seq Output


ChIP-Seq Output


Localization analysis of H3K4me3 chromatin domain boundaries indicates that those domains that occur nearby promoter regions are conserved across different species and are strongly correlated with H3K4me3 domains.

Last update June 2017